November 16th 2026
Semiconductor forecasting: combine signals, then test them
SC4EU forecasting work shows how classical methods, neural networks and order information can complement each other - and why every result has to be checked on unseen data.
Forecasting semiconductor demand is difficult partly because the market itself moves faster than many planning cycles. WSTS expected the 2026 market to reach about USD 975 billion in its late-2025 forecast. Its Spring 2026 forecast raised that to about USD 1.51 trillion, and after replacing Q2 assumptions with actual results, the August update calculated a full-year level of about USD 1.655 trillion. [1][2]
SC4EU addresses a narrower operational question: which signals improve short-horizon forecasts, and how can the improvement be demonstrated rather than assumed?
A hybrid model on 1,189 semiconductor products
Raphael Herding and Lars Mönch studied demand and firm-order data for 1,189 products over 28 months from a large semiconductor manufacturer. Their one-step-ahead approach compared order-entry information, book-to-bill, exponential smoothing and an LSTM neural network, both separately and in combinations. A genetic algorithm selected the weights of the combined forecasts. [4]
|
Approach |
Published score (higher is better) |
|
Order entry |
49.31 |
|
Book-to-bill |
52.79 |
|
Exponential smoothing + order entry |
56.37 |
|
LSTM |
64.19 |
|
LSTM + exponential smoothing |
73.60 |
|
LSTM + order entry |
76.84 |
|
LSTM + exponential smoothing + order entry |
86.28 |
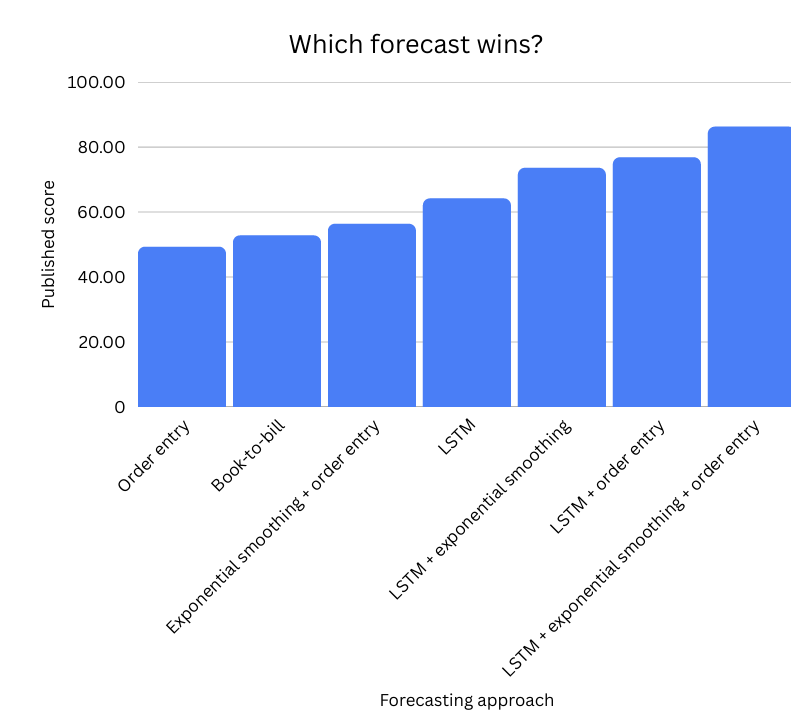
The largest single improvement over the LSTM alone comes from adding firm-order information. Adding exponential smoothing as a third signal produces the best result in the published comparison.
The metric needs careful reading. The paper labels it SMAPE but defines an accuracy-oriented score where 100 is perfect and higher is better. Using the paper’s formula, the best three-signal result corresponds to total absolute error equal to roughly 13.7% of combined forecast and actual volume; the LSTM alone corresponds to about 35.8%.
The LSTM was trained on the first 80% of the series and evaluated on the final 20%. That separation matters. A model has to be judged on data it did not use for training.
The same pattern appears outside this dataset
The large M4 forecasting competition reached a similar methodological conclusion: top-performing approaches combined different forecasting techniques rather than relying on a single model family. The datasets and industries are different, so this is supporting context rather than proof that one architecture will dominate semiconductor forecasting. [5][6]
A second SC4EU study: what leaves the fab, and when
SC4EU has also published work on weekly fab-output forecasting using 2023-2024 data from STMicroelectronics Crolles. For the 20 highest-volume products, the study predicts each lot’s remaining cycle time and assigns it to an expected departure week. [3]
|
Result |
Value |
|
Correct departure week at an 8-week horizon |
41.55% |
|
Correct departure week at a 12-week horizon |
33.39% |
|
Mean absolute error of remaining cycle time at 12 weeks |
13.06 days |
|
12-week accuracy: training vs test |
50.24% vs 33.39% |
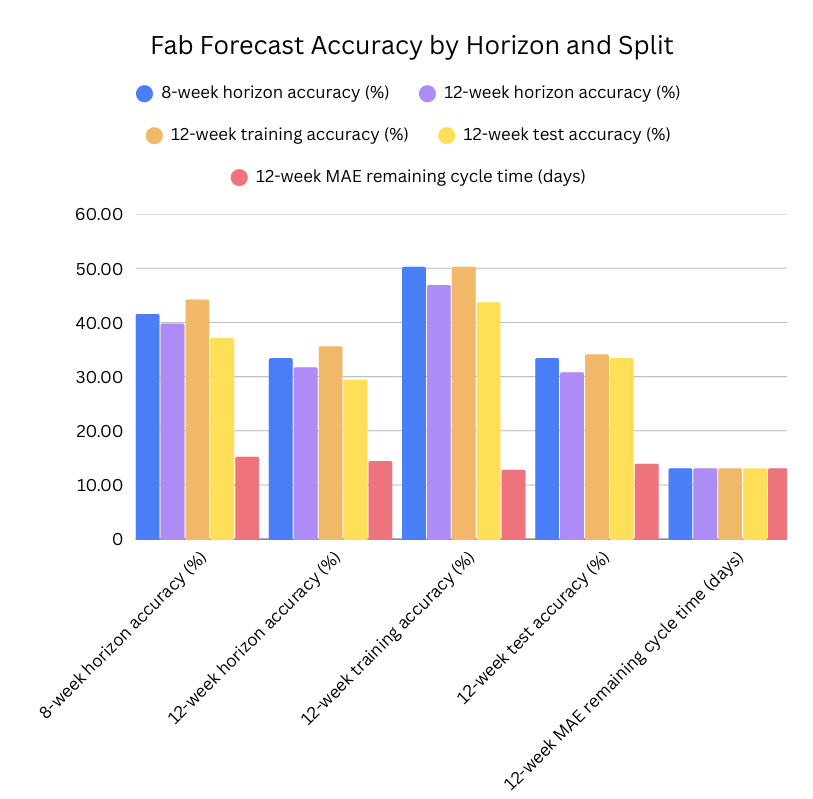
The horizon effect is clear: accuracy decreases as the forecast moves further ahead. The training-versus-test gap is equally important. It shows why a good fit to historical data is not enough on its own.
What to check before calling a forecast useful
-
Use the same information cut-off for every model being compared.
-
Evaluate on unseen data and report the forecast horizon.
-
Print the metric definition next to the result, especially when the name is non-standard.
-
Separate forecast accuracy from business impact. Inventory or service-level improvements need their own evaluation.
The current evidence supports hybrid forecasting and disciplined evaluation. It does not support a universal claim that AI beats classical methods, or that a higher forecast score automatically reduces inventory. The method has to be matched to the decision, the horizon and the data available at that point in time.
Sources
1. WSTS: Global Semiconductor Market Approaches USD 1T in 2026 — Autumn 2025 forecast — https://www.wsts.org/76/103/Global-Semiconductor-Market-Approaches-1T-in-2026
2. WSTS: Global Semiconductor Market records exceptional growth in Q2 2026 — Q2 2026 update — https://www.wsts.org/76/Global-Semiconductor-Market-records-exceptional-growth-in-Q2-2026
3. SC4EU: From Lots in Progress to Weekly Fab Output — 1 September 2026 — https://www.sc4.eu/index.php/news-events?catid=8%3Anews&id=95%3Afrom-lots-in-progress-to-weekly-fab-output&view=article
4. Herding, R. & Mönch, L.: “A Hybrid Approach for Short-Term Demand Forecasting: A Computational Study”, Winter Simulation Conference 2025 — https://www.informs-sim.org/wsc25papers/inv157.pdf
5. Makridakis, S., Spiliotis, E. & Assimakopoulos, V.: “The M4 Competition: 100,000 time series and 61 forecasting methods”, International Journal of Forecasting 36(1), 2020.
6. Smyl, S.: “A hybrid method of exponential smoothing and recurrent neural networks for time series forecasting”, International Journal of Forecasting 36(1), 2020.
7. CORDIS: SC4EU project record and publications — https://cordis.europa.eu/project/id/101139949/results